Servo has been working on improving our Firefox devtools support as part of the Outreachy internship program since June, and we’re thrilled to share significant progress.
Devtools are a set of browser web developer tools that allows you to examine, edit, and debug HTML, CSS, and JavaScript. Servo leverages existing work from the Firefox devtools to inspect its own websites, employing the same open protocol that is used for connecting to other Firefox instances.
While relying on a third party API allows us to offer this functionality without building it from scratch, it doesn’t come without downsides. Back in June last year, with the release of Firefox 110, changes to the protocol broke our previous implementation. The core issue was that the message structure sent between Servo and Firefox for the devtools functionality had changed.
To address this, we first updated an existing patch to fix the connection and list the webviews running in Servo (@fabricedesre, @eerii, @mrobinson, #32475). We also had to update the structure of some actors (pieces of code that respond to messages sent by Firefox with relevant information), since they changed significantly (@eerii, #32509).
One of the main challenges was figuring out the messages we needed to send back to Firefox. The source code for their devtools implementation is very well commented and proved to be invaluable. However, it was also helpful to see the actual messages being sent. While Servo can show the ones it sends and receives, debugging another instance of Firefox to observe its messages was very useful. To facilitate this, we made a helper script (@eerii, #32684) using Wireshark to inspect the connection between the devtools client and server, allowing us to view the contents of each packet and search through them.
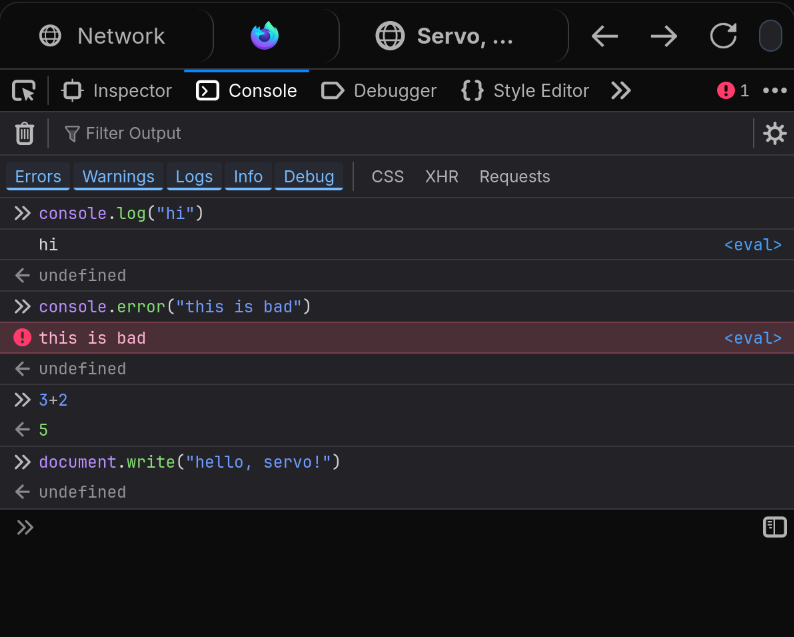
Support for the console was fixed, enabling the execution of JavaScript code directly in Servo’s webviews and displaying any warnings or errors that the page emits (@eerii, @mrobinson, #32727).
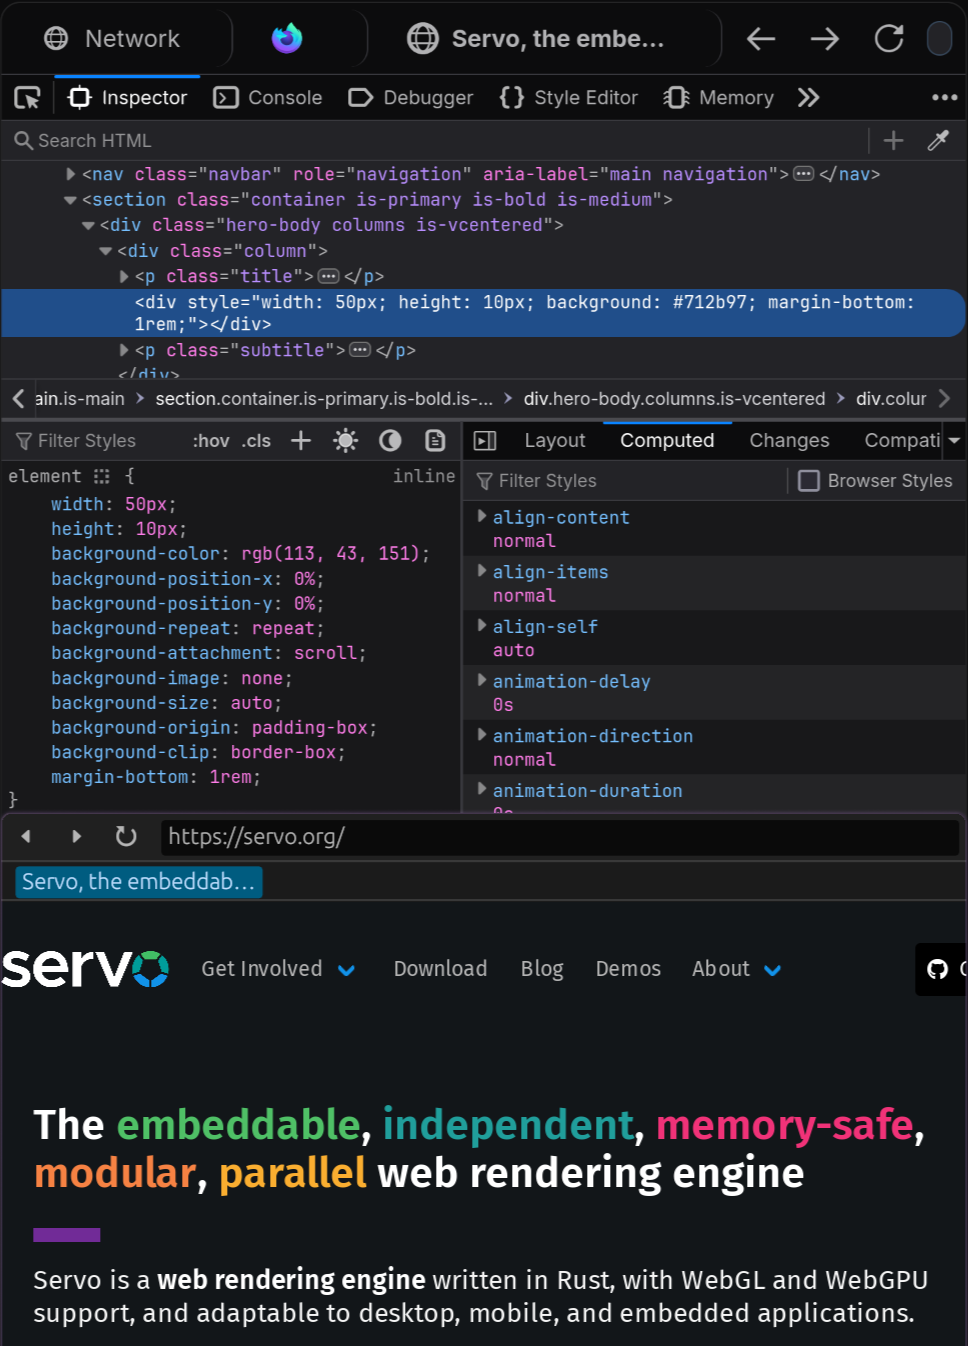
Finally, the most significant changes involved the DOM inspector.
Tighter integration with Servo’s script module was required to retrieve the properties of each element.
Viewing CSS styles was particularly challenging, since they can come from many places, including the style attribute, a stylesheet, or from ancestors, but @emilio had great insight into where to look.
As a result, it’s now possible to view the HTML tree, and add, remove, or modify any attribute or CSS property (@eerii, @mrobinson, #32655, #32884, #32888, #33025).
There is still work to be done. Some valuable features like the Network and Storage tabs are still not functional, and parts of the DOM inspector are still barebones. For example, now that flexbox is enabled by default (@mrobinson, #33186), it would be a good idea to support it in the Layout panel. We’re working on developer documentation that will be available in the Servo book to make future contributions easier.
That said, the Console and Inspector support has largely landed, and you can enable them with the --devtools flag in servoshell.
For a step-by-step guide on how to use Servo’s devtools, check out the new devtools chapter in the Servo book.
We’d love to hear your feedback on how these work and what additional features you’d find helpful in your workflow.
Many thanks to @eerii and Outreachy for the internship that made this possible!