My name is Connor Imes, and this summer I have been working as a Research Assistant with Mozilla’s Servo team. In this post I will introduce you to fine-grained timing and energy profiling in Servo.
Power and Energy
Let’s first clarify the difference between power and energy. I can go into great detail about what energy actually is, but I find it easiest to think of electrical energy in this context as a consumable resource. A Joule is the SI unit of energy. Power is the rate at which energy is used, measured in Watts - Joules per second.
Now consider that you have a task to perform on a computer which requires a fixed amount of work. Completing work fast requires more power than completing it slowly. In a perfect world we could trade that fixed amount of work for a fixed amount of energy, and the power would scale at a 1:1 ratio with the speed increase. For reasons I won’t go into, electrical circuits don’t actually work like that - running faster requires increasingly more power, which costs more energy.
Why do You Care?
You probably don’t notice when applications behave well, but you certainly take note when they run slowly or ruin your battery life, right? Many software systems, like Servo, are subject to timing and energy constraints - they need to provide good performance and minimize energy consumption.
Timing and energy management is especially important on low-performance/low-power systems, like cell phones and tablets. Developers haven’t always paid much attention to this problem - they just configure their software to run as fast as possible. Until recently, this approach has worked well for achieving both good performance and low energy consumption. Unfortunately, this no longer the case on a lot of modern hardware. It is also not likely to work well in the future, particularly on the parallel architectures that Servo is designed to take advantage of.
It may seem counter-intuitive to want to run slower, but some things happen so fast that users would never notice the difference. This presents us with the opportunity to trade performance for energy savings.
Goals
The “pie in the sky” dream is that we can deploy Servo on any system and achieve desired performance with minimal energy consumption. Before we can implement anything like that, we must first understand Servo’s behavior, which brings us to the goals of this work:
- Identify configurable settings and components in Servo that can be manipulated to affect application behavior.
- Instrument Servo to capture fine-grained timing and energy data.
- Execute Servo in various configurations with different workloads and observe/quantify how the behavior changes.
Challenges
Capturing Energy Data
Modern power/energy sensors have relatively low refresh rates - usually not more than a few updates per second, often worse. Such intervals are insufficient for capturing data when tasks complete in millisecond or sub-millisecond time frames. The best we can do without bulky and expensive equipment or too much performance overhead is to use estimates based on hardware counters.
Power/energy sensors are also not consistent across hardware or software platforms. Different hardware has different (if any) power/energy monitoring components. Even for a particular hardware setup, the interfaces for accessing the sensors are not standard across operating systems, requiring platform-specific code.
Furthermore, sensors instrument either specific components of a system or the system as a whole. For example, the Intel Model-Specific Register (MSR) provides energy estimates for core and uncore components, the GPU, and DRAM. Other components like the disk, screen, and network interface are not included, even though they also draw power. On the other hand, using an external sensor provides data for the complete system but doesn’t tell us specifically where the energy is being used.
Parallelism
Servo is designed to perform work in parallel, meaning system resources are shared between concurrent tasks. Since we don’t manage fine-grained resource scheduling, power/energy data cannot be easily attributed to an individual task unless it is the only task running. We can time parallel tasks separately but only capture energy for the shared resources as a whole.
Test Pages
Servo’s capabilities are still under development, but we need sufficiently complex pages for a useful analysis. For our experiments, we selected a couple of pages from the set that Servo can completely load.
Approach
To record timing and energy data, we introduce a simplified version of the Heartbeats API. The new version integrates better with Rust and shifts the burden of capturing timing and energy results to the developer, which is required for recording data from parallel tasks and for cross-platform compatibility. Heartbeats store timing and energy history and compute performance and power metrics. Instructions for enabling Heartbeats and energy monitoring are in the profile crate.
The energymon project supports reading energy data from various sources using a common C interface.
We add Rust bindings and abstractions over this interface.
However, we currently only enable this capability with the energy-profiling feature in Servo since energy monitoring is platform-specific and not universally available.
We run our experiments on a Lenovo Thinkpad X1 Carbon (3rd Gen) with a dual core i7-5600U CPU running Ubuntu Linux 15.04 with kernel 4.2.0-040200rc6-generic. We read energy estimates from the Intel MSR using the Running Average Power Limit (RAPL) sysfs interface. The MSR has a refresh interval of about 1 millisecond.
Servo provides various configuration options, including but not limited to:
- CPU or GPU painting
- tile size
- number of paint threads
- number of layout threads
Varying the number of layout threads seems to have the biggest impact on performance, so we focus on this configuration option for these experiments.
We start with a synthetic webpage called perf-rainbow-hard.html which is included in Servo’s tests/html directory.
We then test a real Wikipedia page (offline for now).
For both pages, we vary the number of layout threads from 1-8 and average the results over 4 trials.
All other settings are the defaults.
Results
We present data in two types of plots.
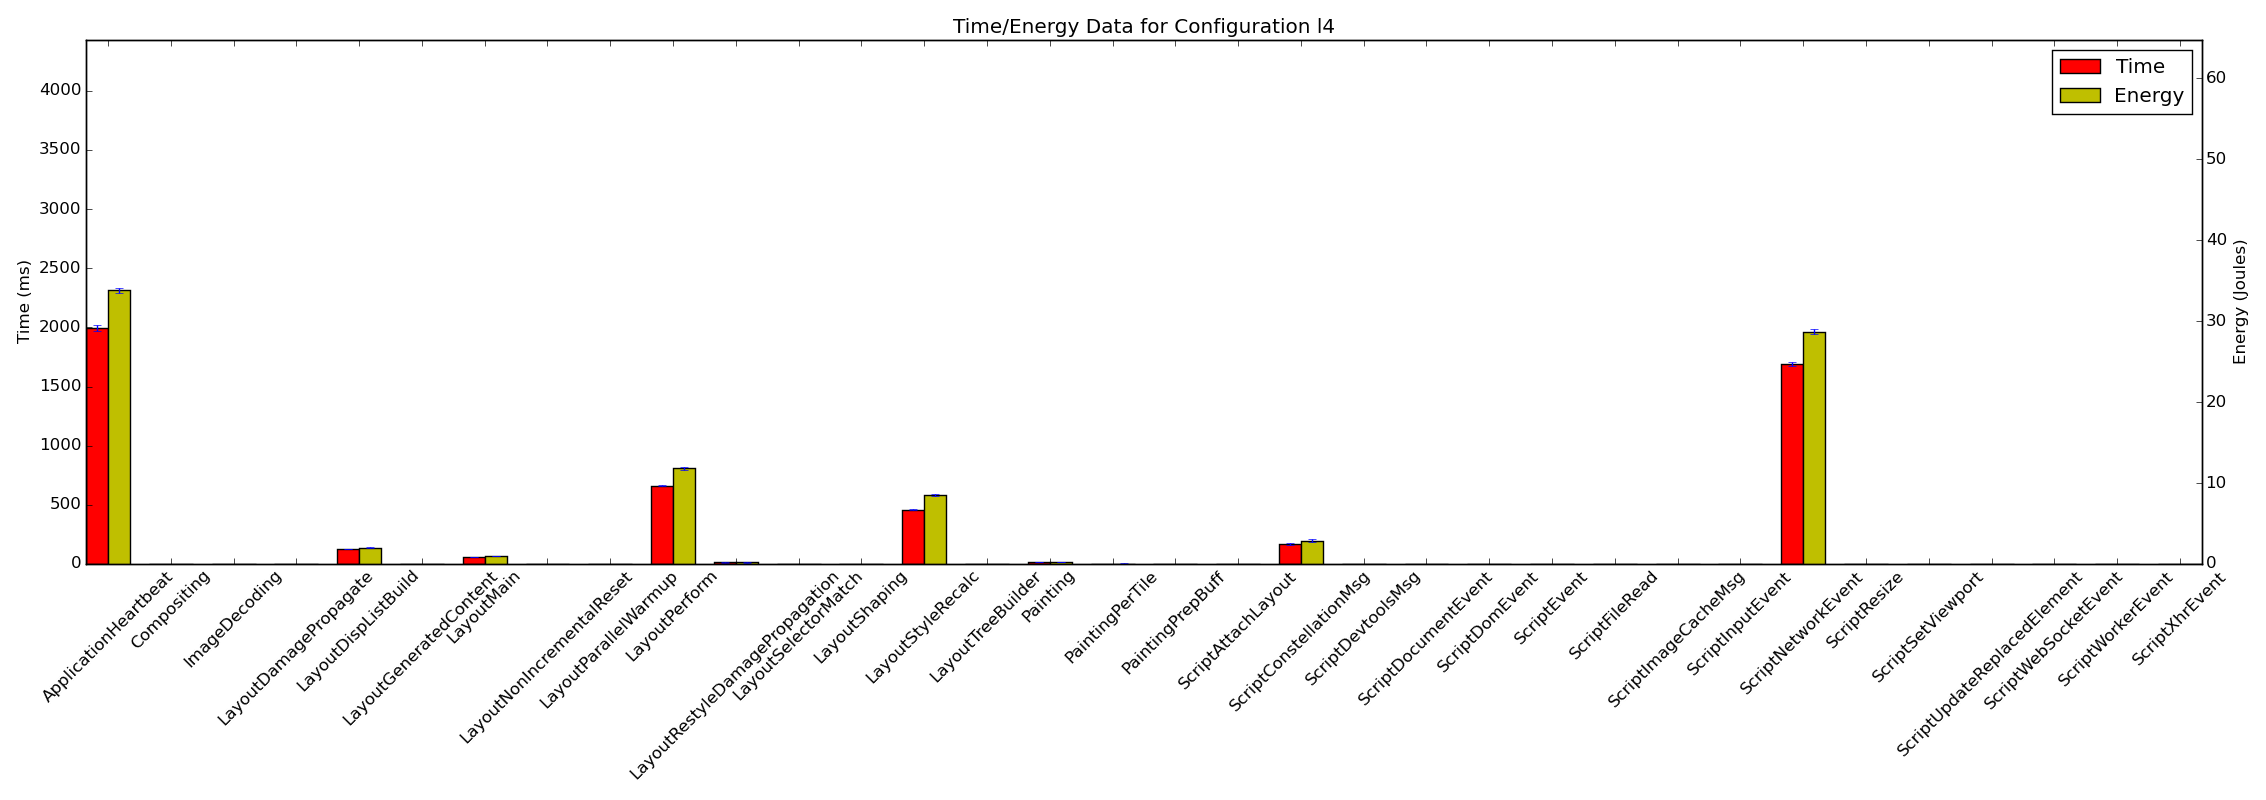
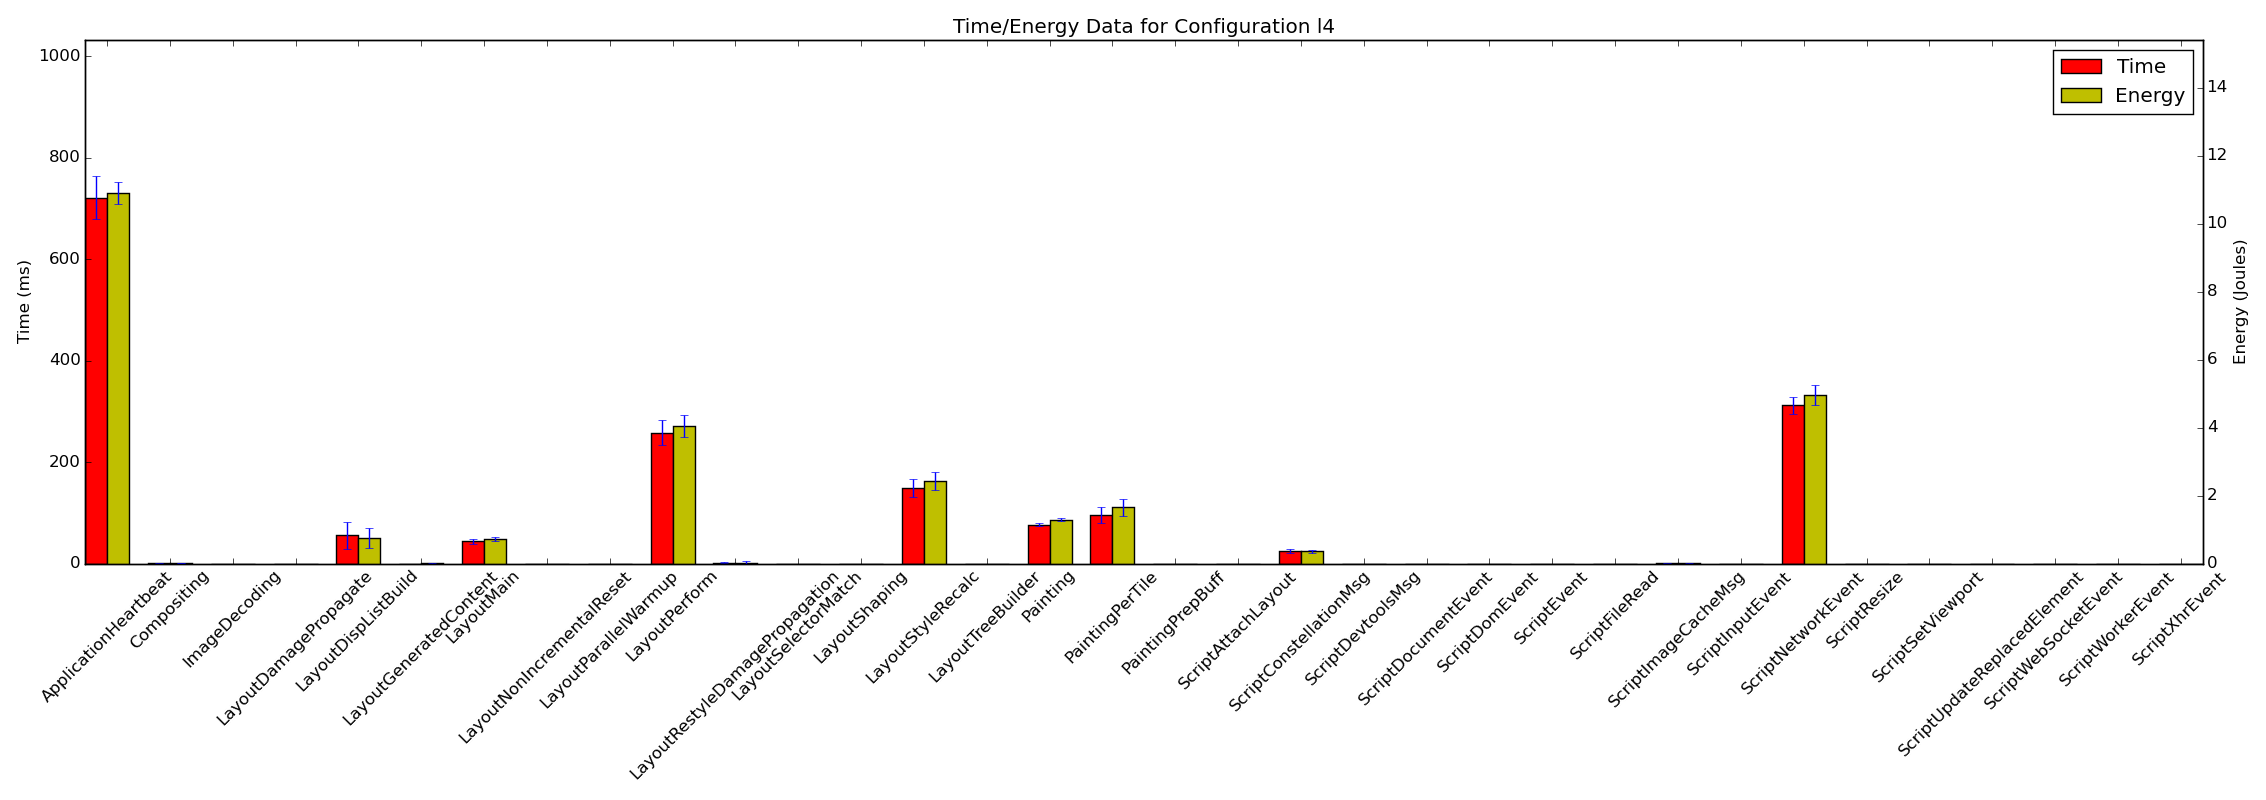
The first plot type is a column chart that naively sums up the time and energy recorded for each profiler category, averaged over the 4 trials (errors bars are included). Recall that tasks run in parallel, even sometimes within a single category. Energy may be counted more than once and the total times will be longer than the wall clock completion time. This plot just gives us an indication of where time and energy are being spent in Servo. The X axis lists the different categories. The left Y axis is the total time in milliseconds; the right Y axis is the total energy in Joules.
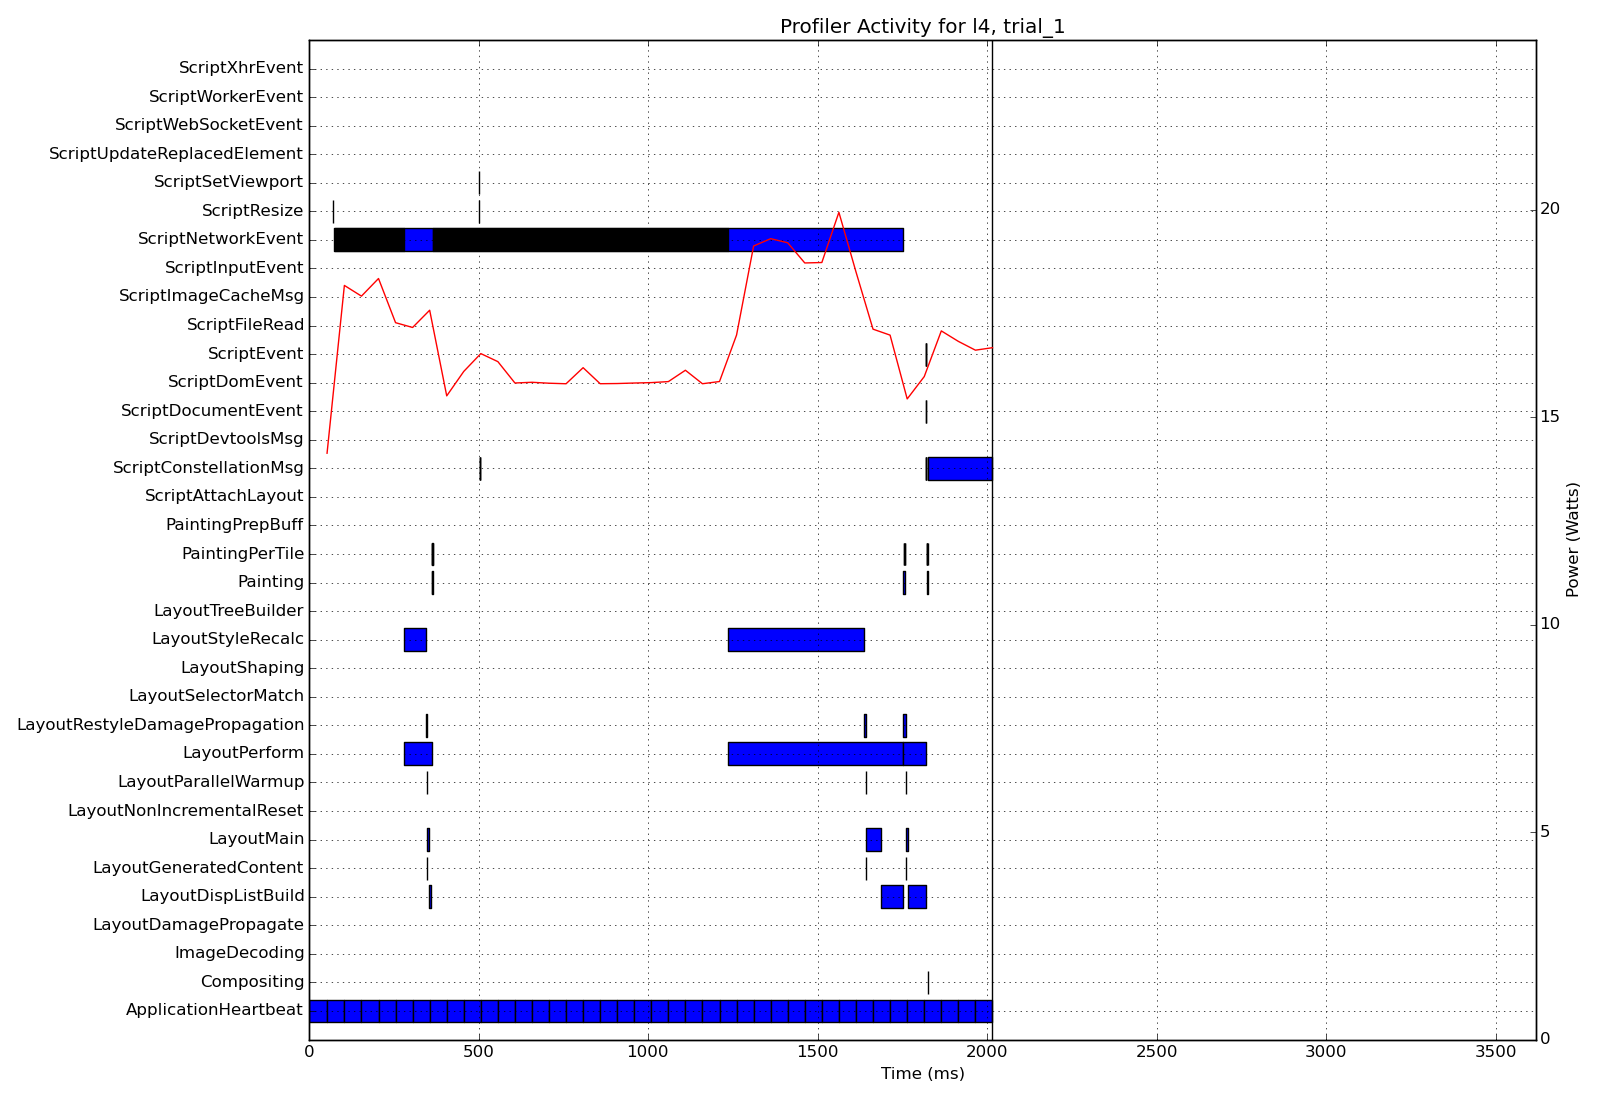
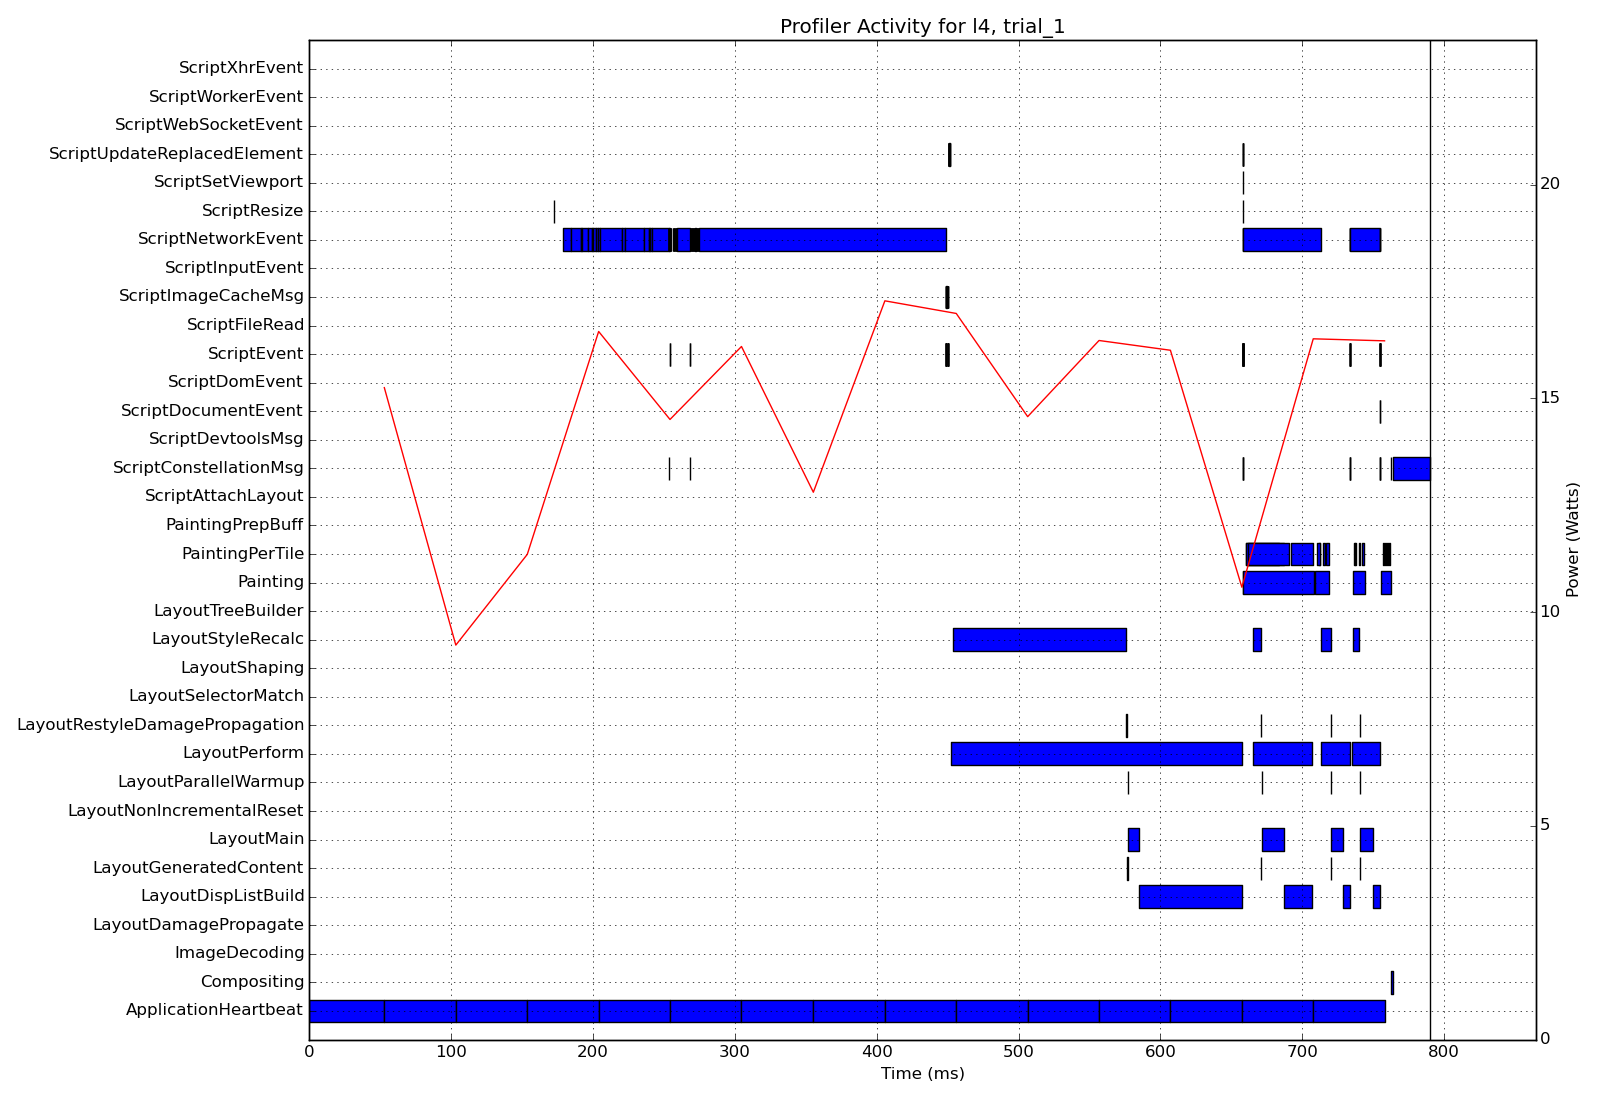
The second plot type is a time series of the profiler categories’ activity for a single trial. Broken horizontal bars indicate when a profiler category is active, and a power curve is plotted over them. Here we can visualize the order of events and how time is really being spent for different workloads. We can also correlate tasks with energy consumption by seeing which concurrently running tasks draw more power. The X axis is the elapsed time in milliseconds since the profiler was initialized. The left Y axis lists the profiler categories; the right Y axis is the power in Watts for the red power curve.
There are a few important profiler categories we will encounter:
ApplicationHeartbeatis a recurring task that captures energy results for the entire execution.LayoutPerformwraps all layout tasks (it is double counting), but will clearly indicate the significance of layout operations.ScriptNetworkEventreads blocks of data up to 8 KB in size from the source - the disk in this case.
We will also see that some of the instrumented tasks never run or take so little time that they don’t record energy data. In most cases, these short-lived tasks are not bottlenecks and not critical w.r.t time and energy.
perf-rainbow-hard


ScriptNetworkEvent makes a strong appearance in perf-rainbow-hard.html (737 distinct events) because the file is unusually large - about 6 MB.
Black bars in the time series denote the beginning and end of each event, but most are indistinguishable here.
Power is usually lower during this period since I/O is not CPU-intensive and the disk is not instrumented by the energy monitor.
LayoutPerform also uses a significant amount of time and energy.
Notice how the power increases during this period.
LayoutStyleRecalc uses the majority of the layout time, followed by LayoutMain and LayoutDispListBuild, with a few other tasks mixed in.
The execution completes with a ScriptConstellationMsg.
This callback from the constellation component is likely a notification that graphics rendering is complete.
I would hypothesize that some type of cleanup work is being performed, but further investigation is required to know for sure.
The total runtime for this execution is 2.09 seconds, consuming 35.07 Joules of energy for an average power of 16.74 Watts.
Wikipedia


Looking at the column chart for our Wikipedia page, we see that a lower fraction of the total time is spent in ScriptNetworkEvent and a higher fraction is spent in layout tasks.
Still, the page is fairly large at about 320 KB, plus another 1.2 MB of additional images and CSS files.
The time series shows us that the total runtime is much less than perf-rainbow, which also means there are fewer energy samples in ApplicationHeartbeat to draw the power curve with.
Speaking of power, it doesn’t spike to 20 Watts like perf-rainbow did.
This page results in more repetitive layout tasks, possibly caused by additional script events.
The total runtime for this execution is 0.86 seconds, consuming 12.63 Joules of energy for an average power of 14.71 Watts.
Conclusions
We found that using 4 layout threads provided consistent behavior on our test system, which seems reasonable given that it has 4 virtual cores. Single trials of other configurations sometimes beat using 4 layout threads in total runtime and energy consumption, but not consistently. Even if some configurations can sometimes do better, the importance of predictability should not be ignored.
We should also acknowledge the overhead of profiling. Memory overhead is small relative to the entire application, but there are disturbances to task timing. Timing and energy readings require system calls and access to hardware resources which introduce operating system overhead and interference in the processor caches. Combined with issuing a heartbeat, this overhead becomes more pronounced for extremely short-lived tasks.
Heartbeats are designed in-part to be used as a runtime feedback mechanism, but we would not use them for such short-lived tasks.
If needed, heartbeats could be issued every N task events while specifying N as the amount of work for a particular heartbeat.
In some cases, there is a non-trivial amount of variability in timing behavior between trials. While we can attribute some of this to profiling overhead, short runtimes and interference from other jobs running on the system also contribute to this unpredictability. Real software has to deal with these challenges.
This post has been a preliminary investigation into timing and energy behavior in Servo, but is not a complete analysis. Further instrumentation and testing is needed before we can draw more scientifically sound conclusions. We invite you to examine these results further, and to try out profiling for yourself.
Future Work
Short Term
Want to help? There is still plenty of work to do, much of which Servo’s volunteer community can help with.
For starters, profiling is still incomplete - more components and tasks should be added to the profiler so we can better understand Servo’s behavior as a whole.
We also need more energy monitor implementations, especially for sensors in common use today.
This will be particularly important for ARM devices running Linux or Android given that ARM chips have been shown to expose more interesting timing/energy tradeoff spaces.
Current energy monitor implementations are written in C, but contributors can write new EnergyMonitor trait implementations in Rust if they choose.
Servo’s energy module can also be refactored for more modularity in substituting energy monitors.
Long Term
Web pages present widely varying workloads depending on their content. To provide more predictable behavior, Servo needs to make assumptions or derive characteristics about pages before (or early during) processing. It can then make more informed decisions when it is eventually able to configure itself at runtime.
With more complete timing and energy data, we can construct performance/power models for different hardware and workloads. This is a prerequisite for implementing a feedback control mechanism in Servo for meeting performance or power goals. Enter a utility like POET, which is designed to accept a performance goal and minimize energy consumption by manipulating system resources or application settings at runtime. POET uses a behavior model along with a feedback control loop to provide soft real-time guarantees while achieving near-minimal energy consumption.
Acknowledgments
This work would not have been possible without the talented and passionate people at Mozilla Research, especially the core Servo team and volunteer contributors. Thank you, and keep rockin’ the free web!